More
Voting With Light

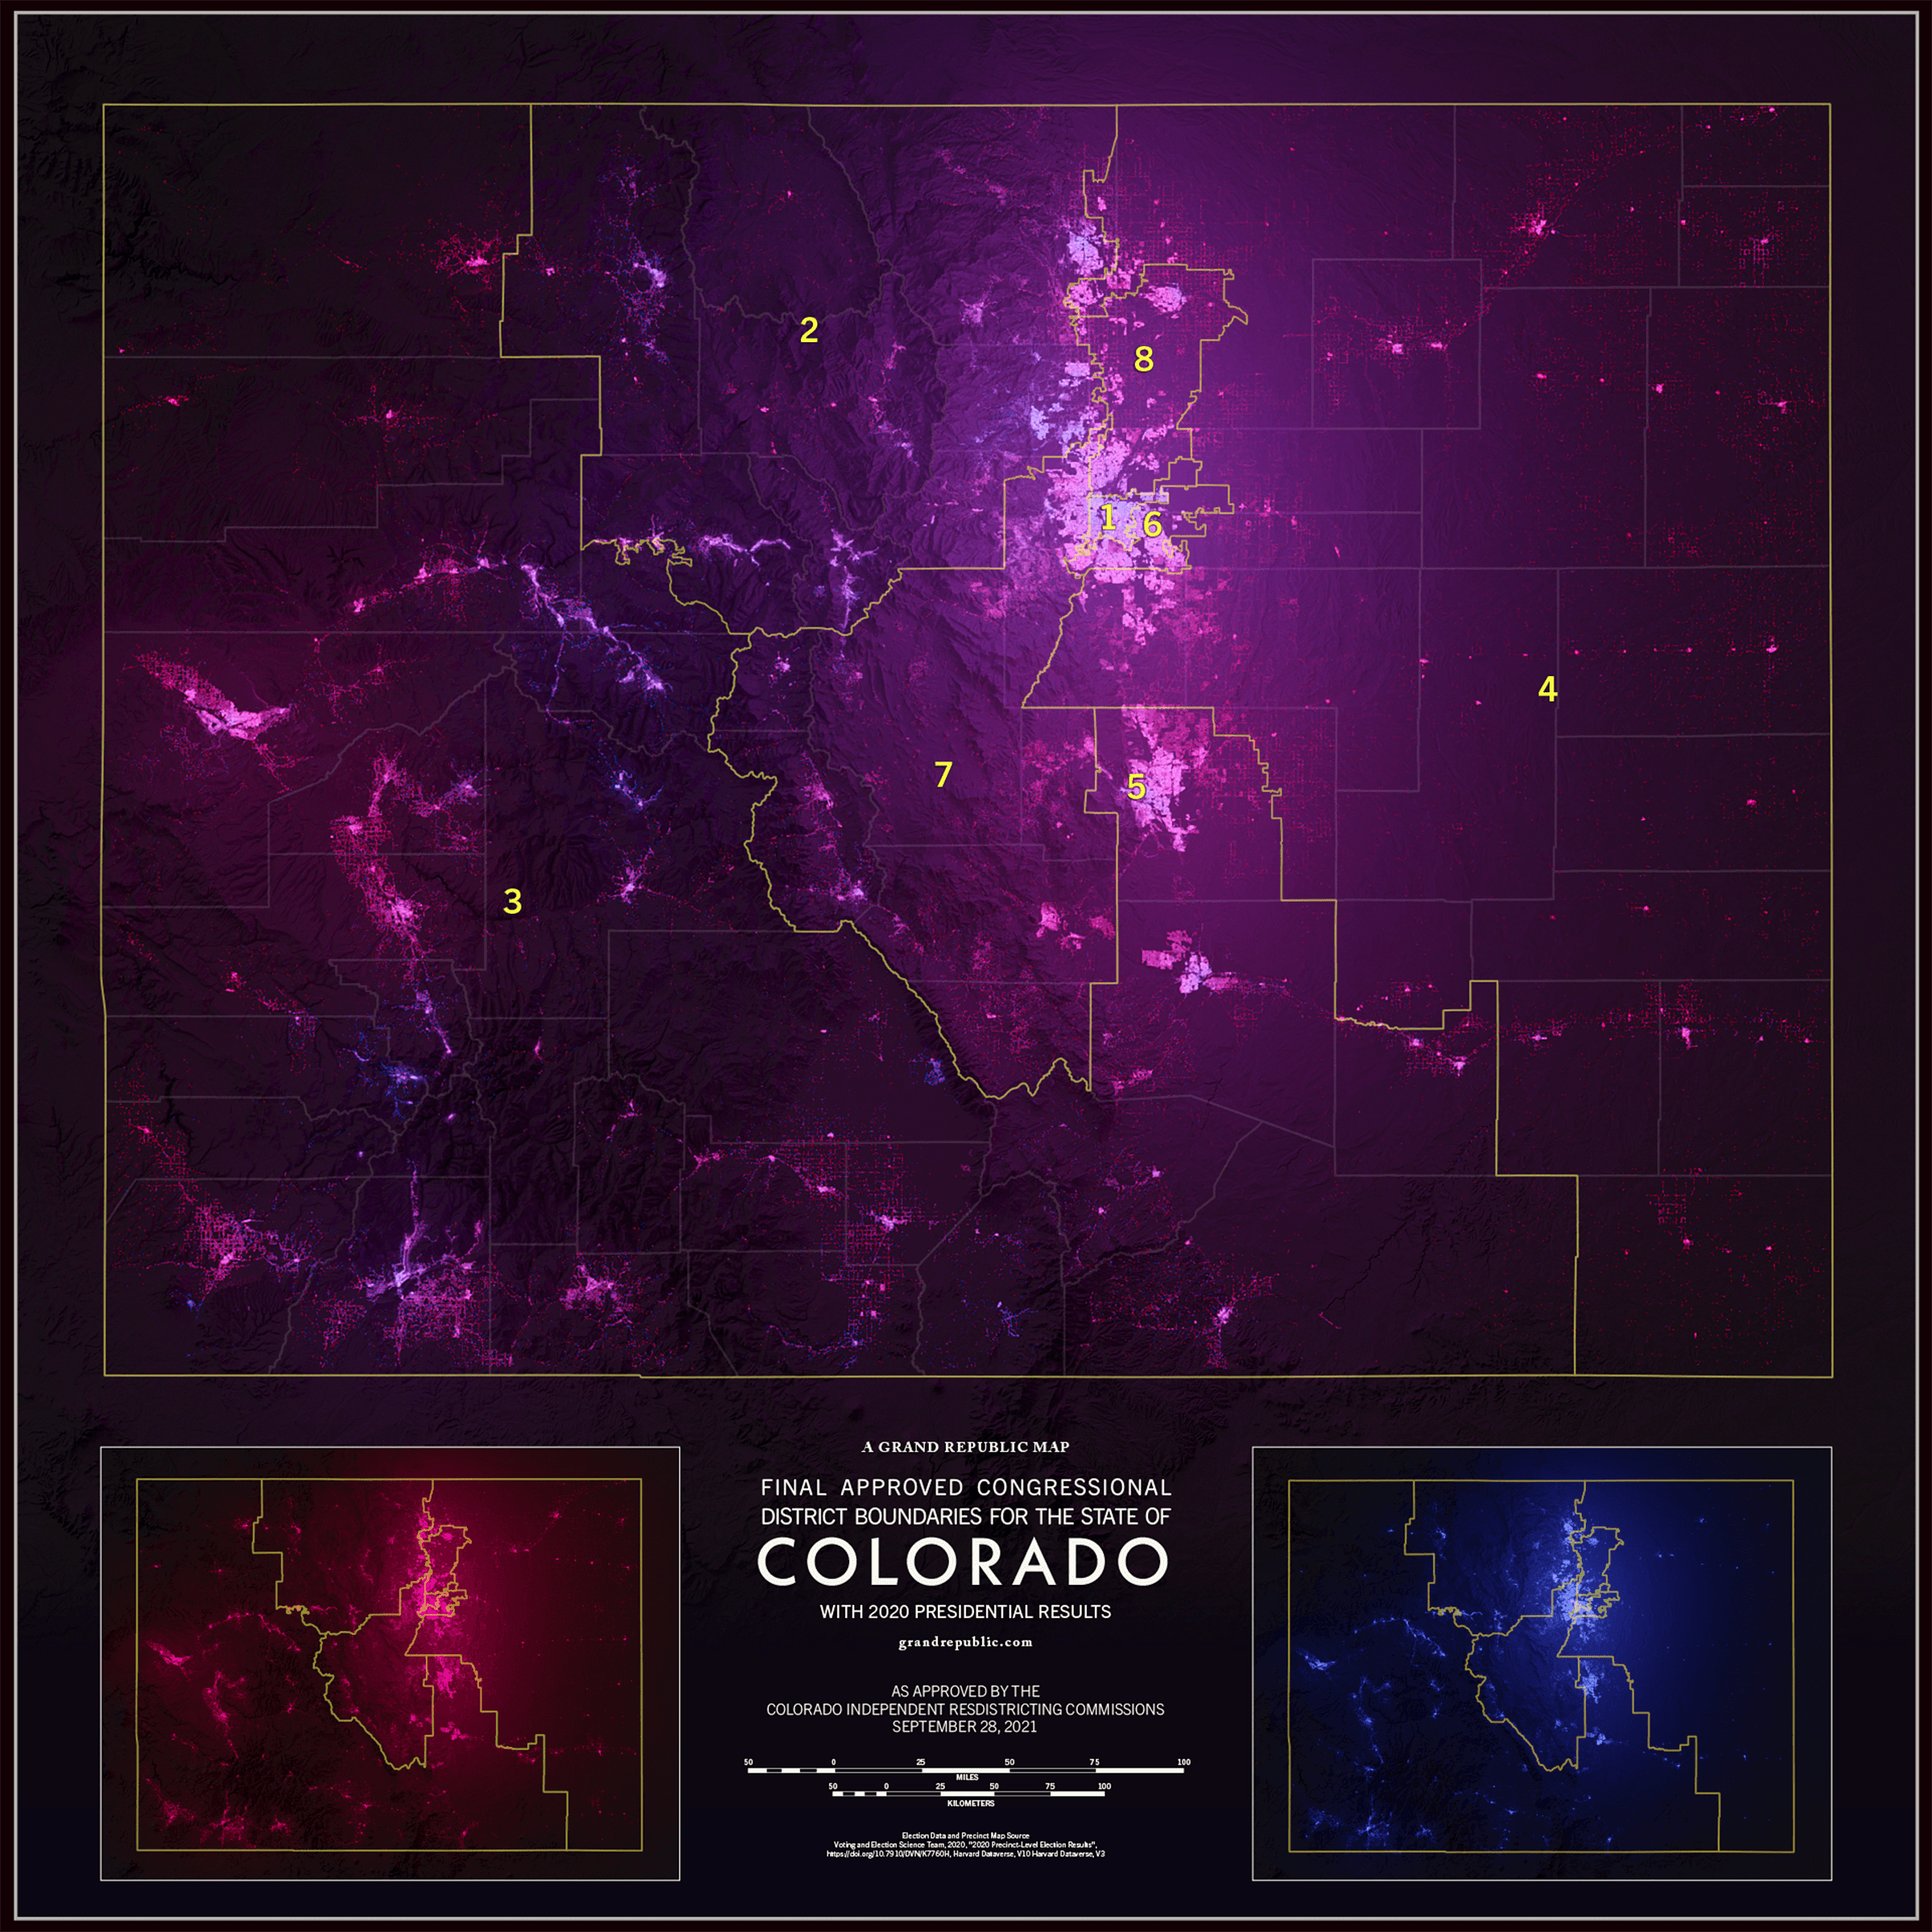
What would it look like if voters shined a colored lamp into the sky on election night to represent their votes? From the greek lámpō for torch and plethos for multitude, these lampopleth maps would be what that might look like from overhead. This type of precision data on election results is not publicly available, so how do we know where to place these votes? A very informed guess. Refining and reshaping hundreds of thousands of census blocks using satellite and geographic survey information produces a map containing only areas in which people are likely to live. Then precinct-level election results are distributed among these refined blocks using a probabilistic formula. Finally, these results are illuminated according to the density of votes and placed on 3D simulated terrain. The result is a highly representative visualization of where voters actually are that eliminates the common misrepresentations of many political chloropeth maps. What remains is a more accurate way of viewing each other that challenges how we think elections are won and lost. The intensity of the voter light shines and reflects off of the terrain; in rural areas, it follows the grid systems of the roads; in the mountains, it snakes up canyons and follows the streets of individual neighborhoods.
Services
- Graphic Design
- 3D Modeling
- GIS Mapping
- Motion Design
- Data Collection
Sector
- Elections
- Politics
- Mapping
- Demographics
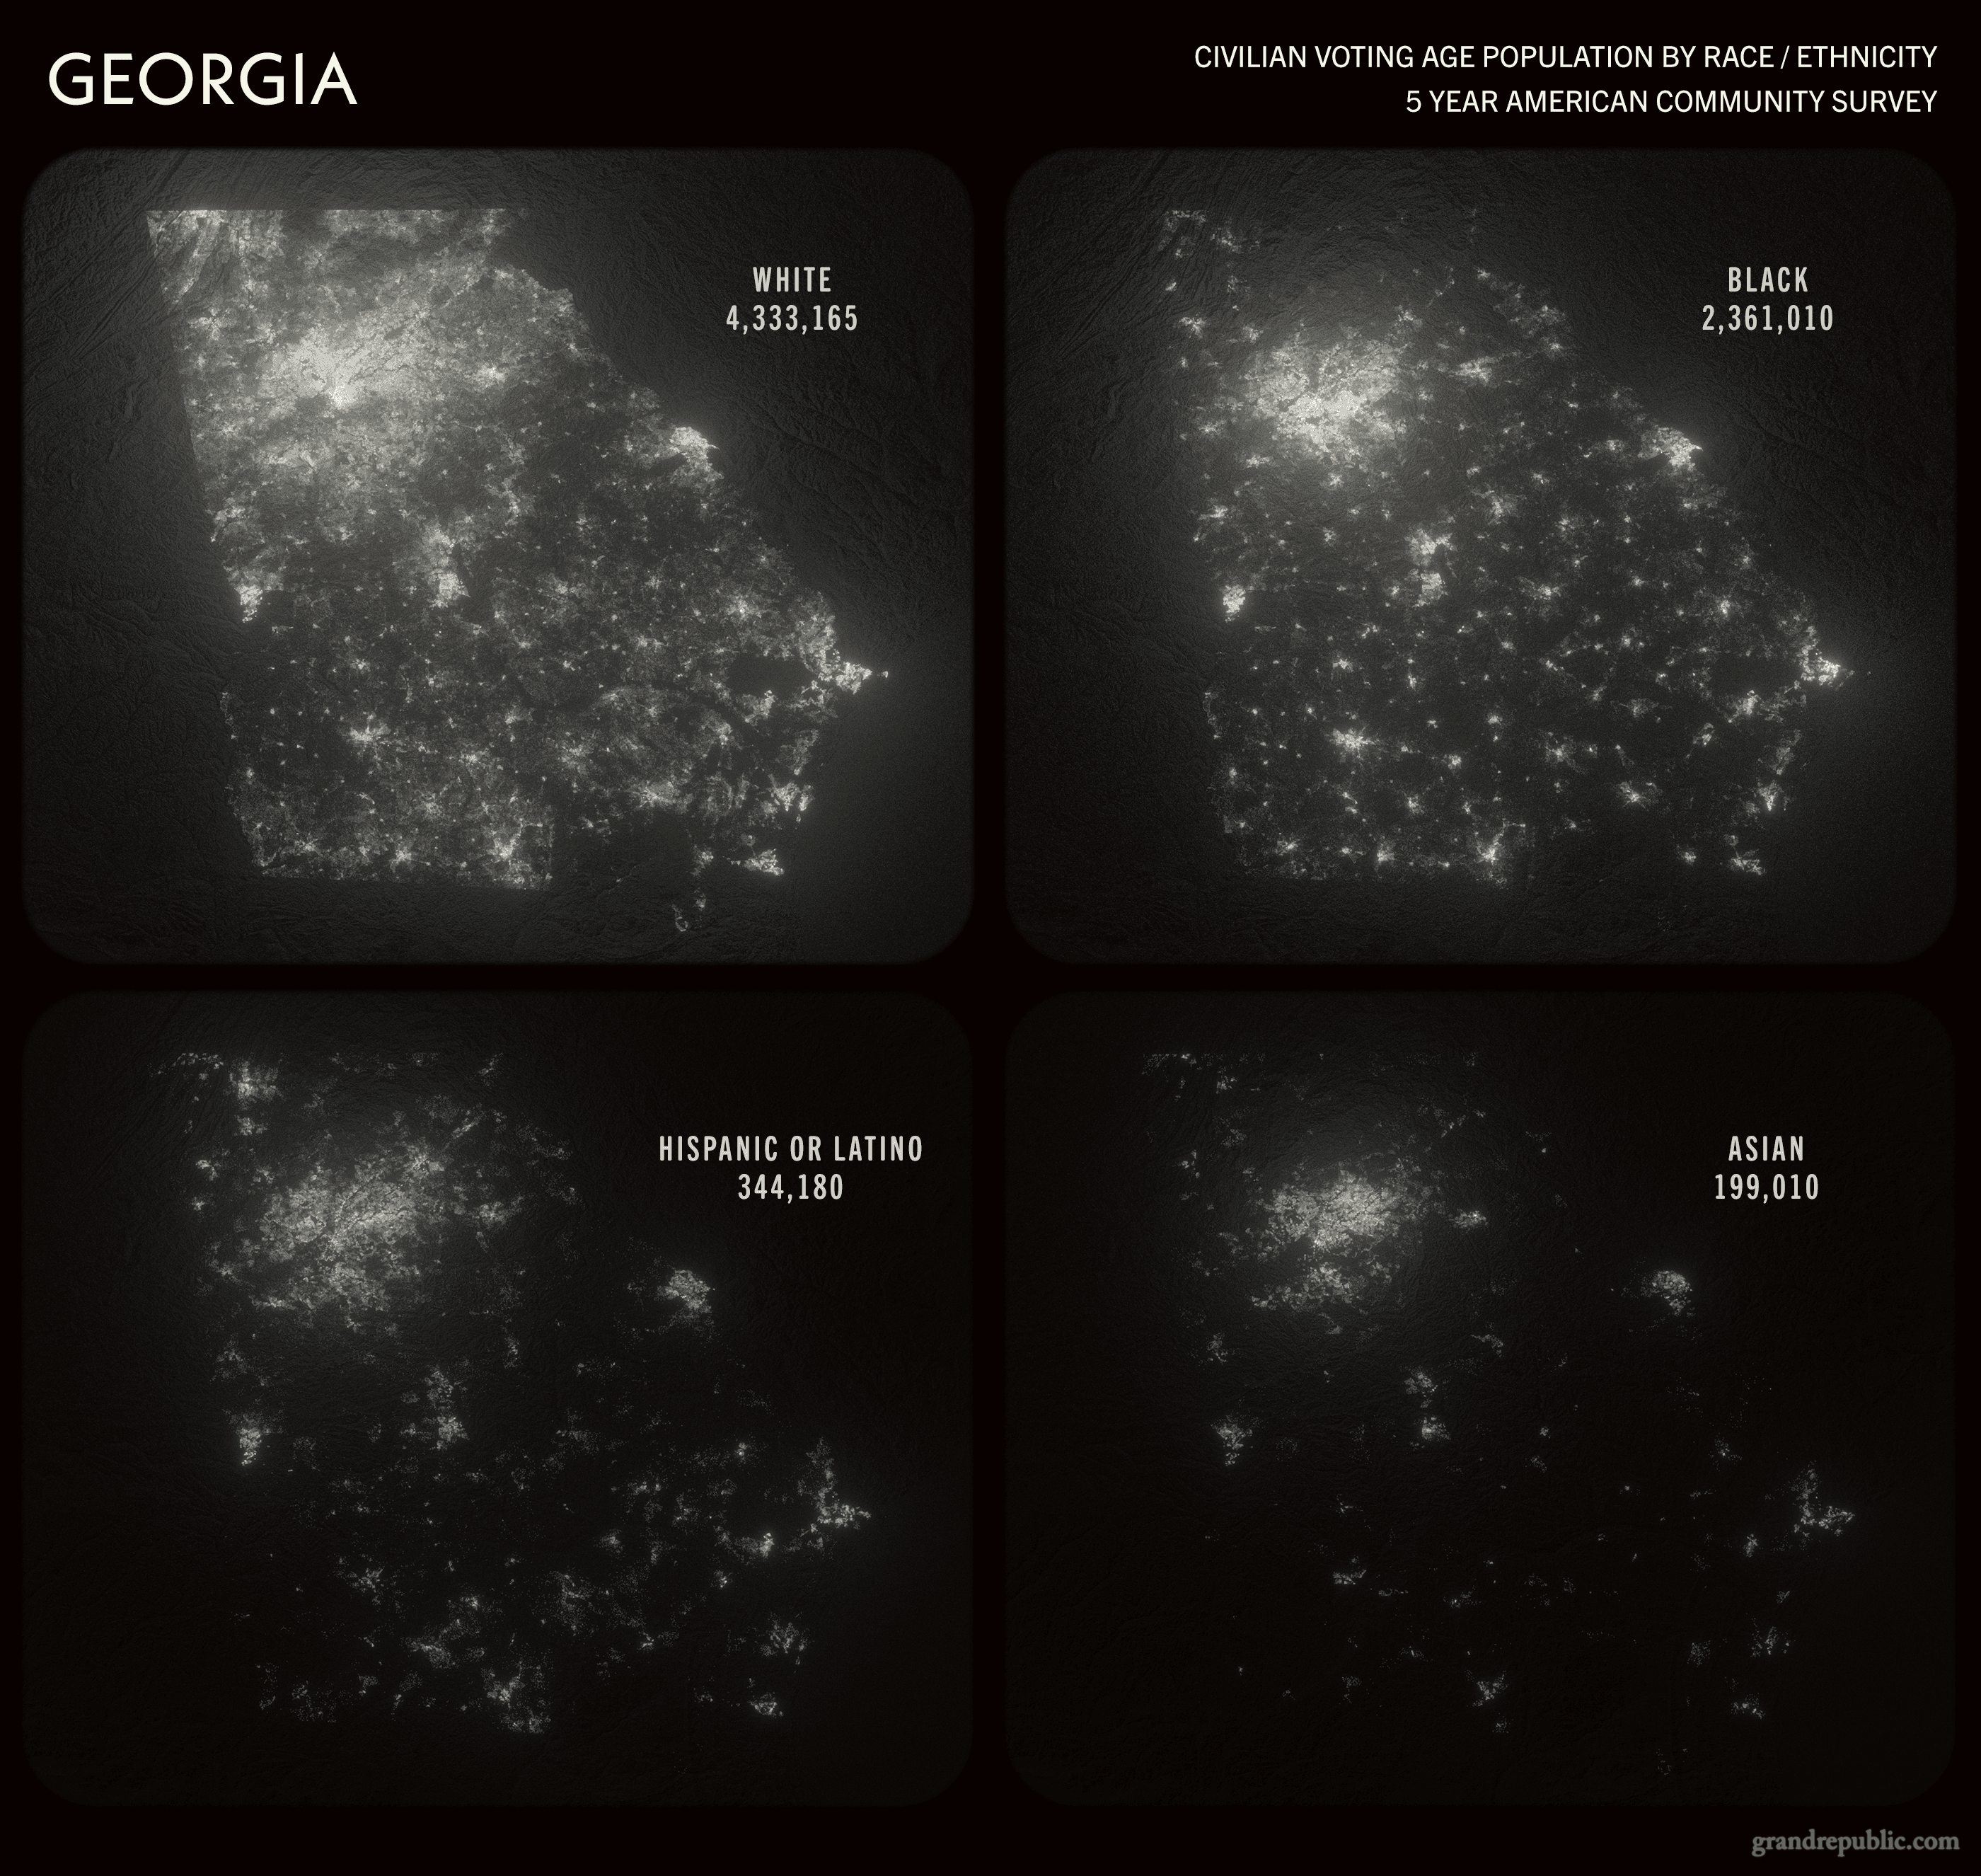
The lampopleth process can also be used to shed light on other demographic features, such as the race and ethnicity of a state's voters. As seen below, in Georgia, the rural cotton belt that was a hotbed of slavery still cuts a swath across the state's center. Over 150 years later, evidence of the Black population's migration from plantations into surrounding towns and cities is still evident.
Ready to launch your next project?
Get In TouchOur Services
Design & Development
Transforming concepts into functional digital solutions.
Outreach & Fundraising
Amplifying impact through strategic engagement.
Identity & Branding
Elevating your image with cohesive visual strategies.
Visualizations & Mapping
Illustrating complex information with clarity and precision.
Schedule A Call

John Horneman
Head Honcho
Our Address
Suite 6154
Arlington, Virginia
22206
United States of America
Legal